How to Truly Understand Users to Solve Their Real-Life Problems Through Design?
Oct 28, 2025

Hi! I'm Alex, a visionary and results-driven Product Designer with 10+ years of experience, specializing in creating innovative, intuitive, and commercially successful products (Web, Mobile, Desktop). This is my first article in a concise but substantial series, entirely dedicated to design processes and results-driven approach to work. I'll strive to explain everything as briefly as possible without losing the essence, yet comprehensively. I'll present it in a way that makes all processes understandable even to complete beginners.
I think most readers are already familiar with the famous "Double Diamond" system, developed by the British Design Council back in 2005. The essence of the approach lies in the two, potentially infinitely repeating, stages of divergence and convergence within each diamond.
In simple terms, the essence is that first, we expand our search in all possible directions, and only then do we proceed to find solutions by synthesizing all the acquired knowledge, while narrowing our focus. We draw conclusions from the data obtained and keep only the most important insights we managed to uncover. Each diamond in this system has two stages (expansion and subsequent synthesis):
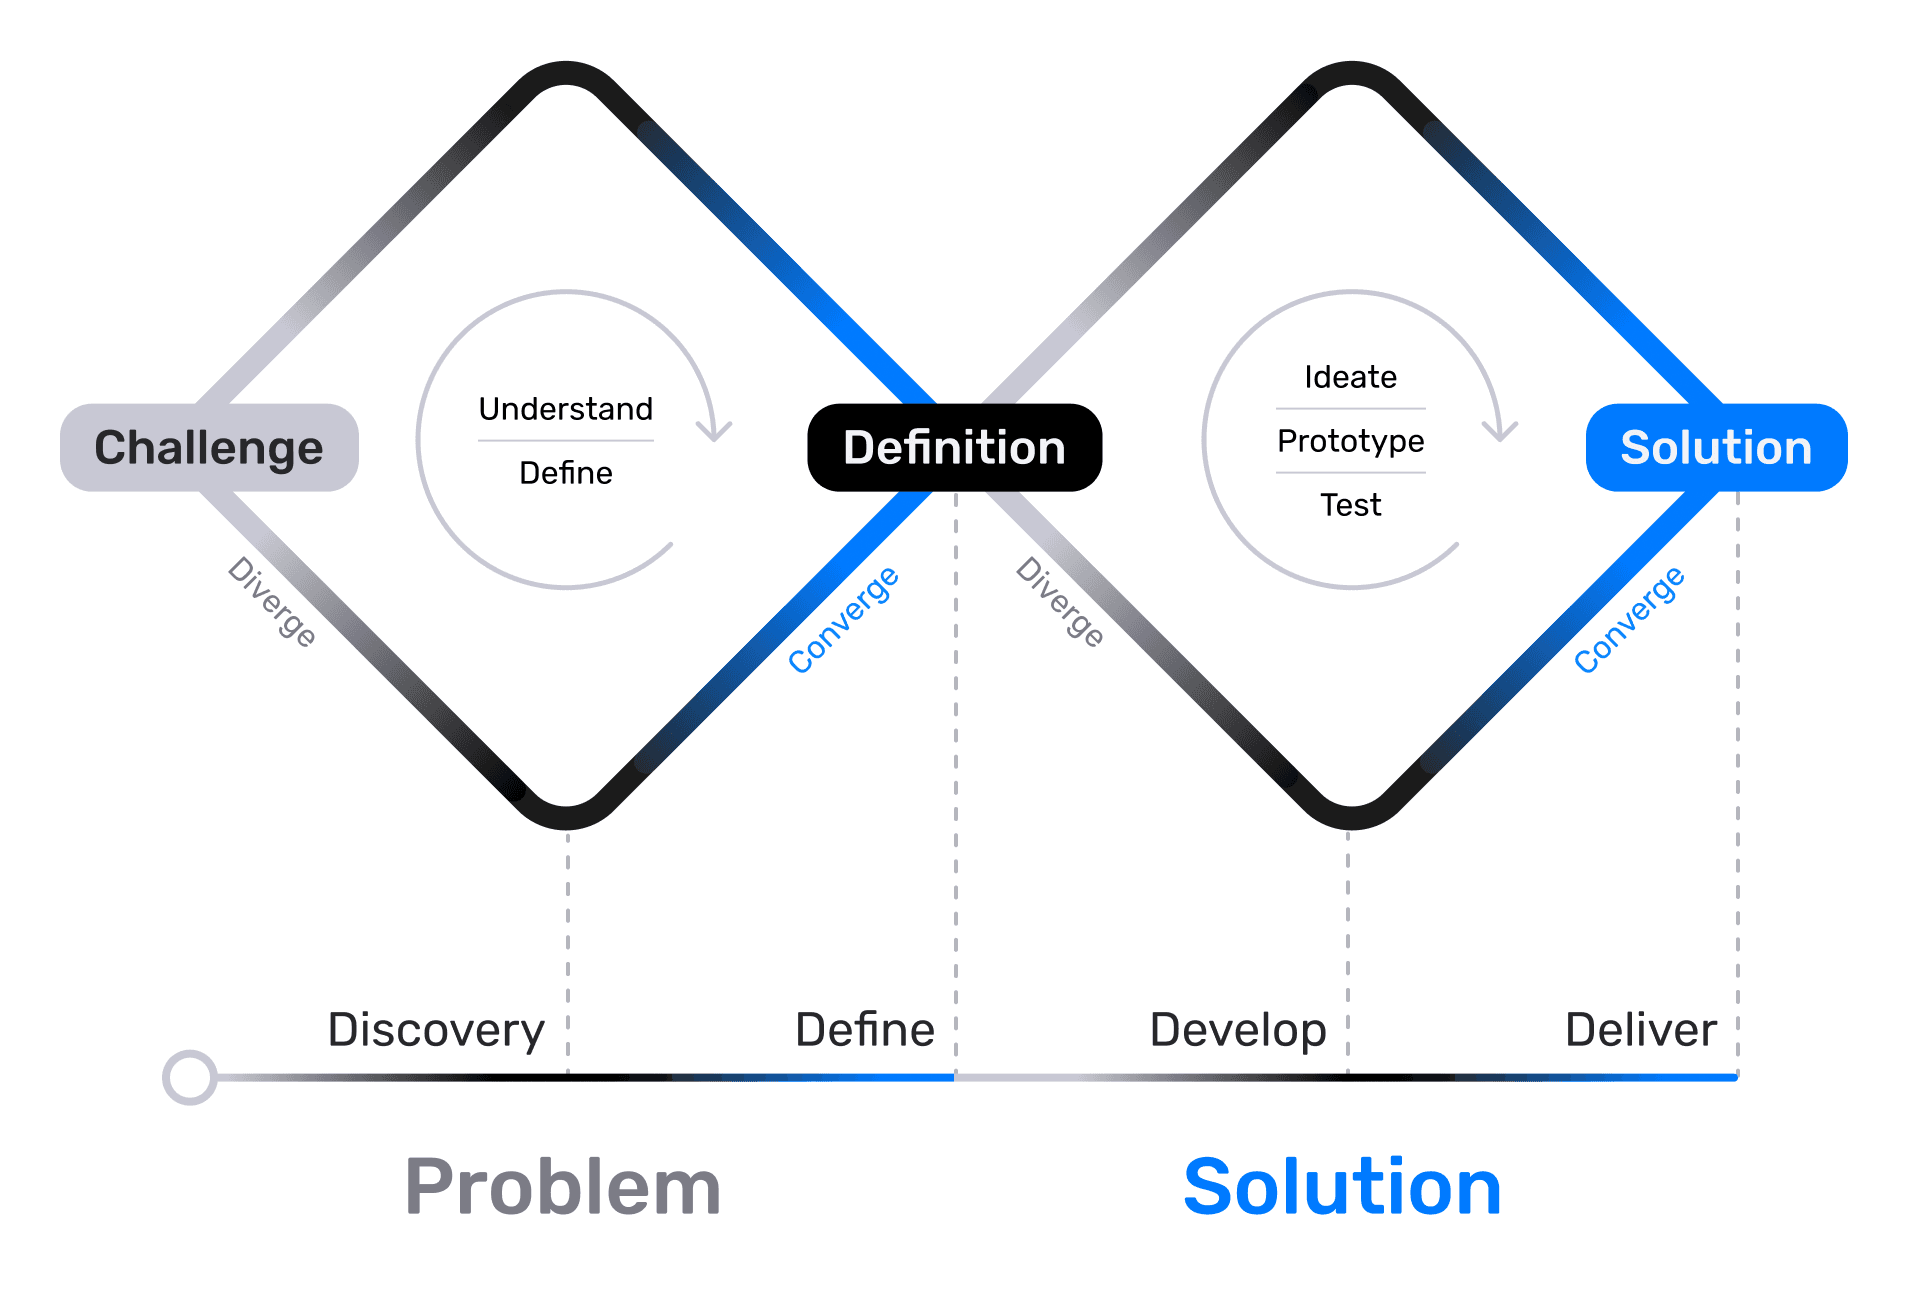
Discovery (Research) — The Divergence Stage (Expanding the Search)
Define (Definition) — The Convergence Stage (Synthesizing Knowledge)
Today, we will focus on the first diamond in more detail. Its goal is to understand our user and identify the real problem. We'll talk about how crucial it is for a designer to understand the pain point they are addressing and the business task they are solving at the moment. We'll also discuss what small teams can do when there's no budget for full-scale research. Let me reveal a secret right away — we will use neural networks, but not in an obvious way; we'll be a bit more clever about it. But everything in its turn.
Diamond 1 (The Problem)
In the classic example, at the first stage, we potentially have access to almost limitless resources; all you need is to convince the business of the necessity for a particular research phase. If you have the opportunity for direct dialogue with users — always use it. Remember, everything we come up with, until it is confirmed by statistical data and real users, is merely a hypothesis that requires validation. Let's recall what the first stage includes:
Part One (Research):
Stakeholder interviews
Analytics and data collection
User interviews
Surveys
Market research
Competitor analysis
Part Two (Definition):
Opportunities, needs, tasks
User segmentation
Research
First, let's recall which tools are at our disposal when resources are available and what a mature approach to problem-solving looks like. At the end of the article, I will explain how we can significantly reduce costs and still achieve excellent results through a genuine understanding of users.
Stakeholder interviews

We should start with stakeholder interviews, and first, we need to identify the circle of stakeholders whose interests are affected by our problem. These can be direct stakeholders, such as the Product Manager, Team Lead, or CEO, as well as indirect ones, such as developers, marketers, analysts, lawyers, and support specialists.
Each component part of each diamond deserves its own separate article, so here I will limit myself to brief mentions and a short list of useful tips.
Key points for conducting interviews:
Notify in advance and send an interview request where we immediately state the goal of our interview. Our objective is to deeply understand the problem from all angles, and we need this person's experience and perspective. We discuss the interview format, usually a short 30-minute conversation. We outline the topics we want to cover (problems/limitations/"field stories"). We confirm availability for the week and proactively suggest several time slots to choose from.
Always explain the research context, for example: "I'm launching a series of research interviews at the Discovery stage to study the problem of low conversion rate for card issuance and understand where the main user pain point lies." (Meanwhile, in our heads, it should sound something like this: "Our users aren't ordering the plastic card. Why? What's stopping them, and do they actually need it? How can we make them want it?" If we can't describe the problem in simple terms, it means we don't understand it ourselves yet and need to think further.)
Prepare our list of questions in advance.
Don't ask for a ready-made solution; ask "Why?", "What?", and "How?". We remember that we came to find out the real problem, not to collect a wish list. We need others' experience and perspective.
Listen without interrupting, ask "Why?" more often, don't be afraid to be the "Why-person," remember the golden rule of "5 Whys."
Find out what technical limitations, blind spots, and risks for the business and users exist regarding this problem.
Record everything. Audio and video record with permission; if permission isn't granted, take notes by hand on paper, or in whatever way is most convenient and doesn't take too much time. A voice recorder on a smartwatch is a wonderful invention :) Quotes will help us defend our decisions in the future.
At the end of the interview, always double-check if we understood everything correctly. For example, ask: "So, is the main problem, from your perspective as a stakeholder, ...?" "Is there anyone else we should talk to?" "Is it okay if I reach out a bit later if more questions come up?"
Pay attention to the emotions our questions evoke, and note the most resonant ones.
Create a brief summary describing the identified problem, risks, limitations, and contradictions between stakeholders if they exist.
Visualize the problem map. We are designers, not programmers. Visual design is, first and foremost, working with text. Dry text is always perceived worse than text + image. Therefore, we try to present everything in a way that allows for quick understanding of the essence, requiring close scrutiny and careful reading only for details. We can use Miro or FigJam and share the results with the team. This shows our interlocutors that we have heard them and creates a shared picture for the team.
After conducting the stakeholder interviews, we move on to the analytics department.
Analytics and Data Collection
If we have our own analytics department, that's great. We can always submit a request to collect the data we're interested in or obtain data that's already available. With a serious approach, we can even start annotating data upfront to create a "golden standard" for subsequent training of ML models.
When approaching the analytics team, our primary goal is to identify behavioral patterns, pain points, and "bottlenecks" in our product. Most importantly, we want to find quantitative confirmation of our hypotheses.
At the stage where we say, "It seems there's some problem with our 'Auto-payments' section, I think it's hard to find," we are at the "just a hypothesis" stage. But when analytics confirms this with numbers and shows that 80% of our users have never opened the 'Auto-payments' page, it transforms into a real, validated problem that needs to be solved.
Below are a couple of examples for general understanding; in real life, the specific questions and their number will depend on each particular pain point/problem.
What requests for understanding users and their behavior can we send to analysts?
Segmentation and Activity Requests
Show me the main segments of our users based on demographics and key behavioral patterns (e.g., "Young parents," "Middle-aged women," "Active investors," "Infrequent payers").
What does the "new user journey" look like? At which steps do we lose the most users?
Behavioral Analysis
Show me the "money transfer" funnel. At which steps is the dropout rate the highest?
Do we have user groups that perform non-obvious sequences of actions to achieve a goal? (If such groups exist and are large, we likely made a mistake in the design somewhere).
Errors and Failures
On which screens/steps is the percentage of errors or canceled actions the highest?
Which search queries within the application most often return zero results?
Support Analysis
What are the most common topics/reasons for contacting the support service? Can we see from which application screen these requests most frequently originate?
Which queries have the highest rate of repeated contacts? (This helps us identify unresolved problems).
Trends and Product Health Metrics
Show the dynamics of key metrics (Retention Rate, NPS, CSAT) for different user segments. Where do we see the most significant drop or growth? (It's important to understand which metrics we need; not all features are measured by your product's key "North Star Metric").
How do our metrics compare to the same period last year?
Validating Our Hypotheses with Numbers
Hypothesis: The complex verification process deters new users. Show me the percentage of successful completions of this process on the first attempt.
We assume users cannot find the "Auto-payment" function. Show me how many users who regularly make manual utility payments have never visited the "Auto-payments" section.
What to remember when making requests to analytics:
Define what we want as specifically as possible. For example, who is an "active user" in our understanding? A user who was online at least once in 30 days, or a user who completed a transaction?
Ask for data, not conclusions, and ideally ask for raw data as well. Sometimes it's crucial to look at an anonymous user journey to see real scenarios. Graphs alone are often insufficient.
User Interviews
When conducting user interviews, it's essential to follow the same principles as when interviewing stakeholders: we are simply attentive listeners. We spend 80% of our time listening and 20% asking questions. When preparing for user interviews, it's beneficial to hold brief meetings with stakeholders involved in the hypothesis we want to test. They can help formulate questions, become more engaged in the process, and trust us more when we present and defend our solutions. It's also good to invite them as observers.
A few tips and a brief guide for user interviews:
Define clear goals. For example, not just "understand users," but specifically: "Understand how small entrepreneurs track their expenses and why they still use Excel for this instead of our product?"
Develop a guide and a brief interview structure for yourself. Remember, this is not a questionnaire but a friendly conversation during which we want to explore specific points of interest. Typically, the structure looks something like this:
Introduction: Introduce ourselves, explain the purpose of the interview, mention confidentiality, and obtain consent for recording. If the respondent doesn't know your role on the product, it's better to say you're a marketer wanting to improve the product. Almost every time I said I was a designer, the interviewees' creative juices started flowing, and they tried to implement their ideas through me (even freelancers often have stories like "You stand next to me and tell me how to do it" — that's a x2 to the price tag; we're not here for that).
Warm-up: Just a couple of minutes of easy questions about their role, experience, and context ("What do you do?", "What does your typical day look like?").
Main part: During this section, we ask questions related to the research goal. Remember, we are interested in real cases and the user's past actions and behaviors. We avoid hypothetical questions about the future. Future-oriented questions are only appropriate when a user says something like, "There should be another 'Button' here," then we can ask what task they would solve with it.
Conclusion: Here we ask if there's anything else important in the context that we haven't discussed, who else we should talk to, and we thank them for the interview.
Find respondents. This is probably the most difficult and crucial stage. It's essential to screen respondents very carefully, as one "freeloader" or "fantasist" can ruin everything. We don't chase quantity; quality is important to us. Usually, 5-7 interviews are enough to identify 80% of the problems. We need to clearly define who we want to interview (e.g., "users who have used feature 'X' at least once in the past week but haven't completed the target action"). You can search via internal mailing lists, customer databases (coordinating with support and marketing), social media, specialized platforms, or you can order them through an agency. Always offer some kind of bonus for the interview — this could be product bonuses, merch, or direct payment, usually in the range of $60-$100 (unless we're inviting a domain expert, where the rates are of a different order).
Conduct the interview itself. Strive to create the most comfortable and relaxed atmosphere possible, so the respondent feels like they're talking to an old acquaintance. During the conversation, pay attention to non-verbal cues: pauses, sighs, changes in intonation — these are clear signs the person is talking about something important to them. Don't try to solve the problem on the spot and avoid leading questions like "Was it difficult for you to...?" It's better to ask "How did your experience with... go?".
Process the data. Ideally, immediately after the interview, discuss with the observer what key insights were uncovered and what initial impressions were formed. Then, proceed with data transcription; you can use services like Otter.ai or Trint.com, for example. As a last resort, take notes on the key points.
Sort the data. Use affinity mapping: write down all interesting quotes, then group them by themes and build a semantic map in Miro or FigJam. This will help us identify patterns.
Formulate insights and recommendations. An insight is an observation + context + cause. For example: "We noticed that users aren't using the autopay feature. This is important because it's one of the key features of our app. We think this happens because the feature is hard to find in the interface." Next come recommendations, which should be specific and tied to the insights. For example: "Since users can't find autopay, we suggest adding an 'Autopay' button to the list of past payments and pinning it to the top/beginning of the list."
Prepare a presentation for the team. Don't just throw a Google Doc into a general chat for them to figure out. Instead, prepare a good, comprehensive presentation where you tell a short story, revealing the research goals, showing the most striking quotes, insights, and identified patterns. (You can also involve team members in the affinity mapping stage to improve understanding, increase engagement, and, incidentally, simplify defending your findings). At the end of the presentation, summarize: which hypotheses were confirmed/refuted? Propose your solutions and ask what we will do next (design, development, new research)?
I always remember that my role as a designer isn't just to "talk to users"; I do this to later become the user's ambassador within the team. My task is to transform the varied opinions of those interviewed into structured, validated data upon which confident decisions can be based. At the same time, I remember the business interests, but the user is always more important to me; in all debates, I remain on the user's side, because a dissatisfied user will simply leave for another product.

Surveys
1. Defining the Survey's Purpose and Philosophy
First, we need to define the survey's purpose and its underlying philosophy. We are not going to ask users if they like our new feature; we want to find out under what circumstances problems arise, how they currently handle things, why they do it that way, and what irritates them.
2. Focusing on the Problem and Crafting Questions
Having defined the goal, we need to focus specifically on the problem, not its solution. At this stage, we need to compose a series of questions that concern us the most; ideally, there should be no more than 7. Questions can be of various types; let's look at the most common ones:
Open-ended — Used when we want a detailed answer to understand the context (e.g., "Describe the process of how you plan your vacation.")
Behavioral — Used to learn about actual past actions, not intentions (e.g., "Think back to the last time you saved money for a specific goal. What did you do?")
Pain/Point of Joy Questions — Asked to identify the most emotionally charged points (e.g., "What is the most irritating part of sending money to people in your contacts?")
Ranking Questions — Used when we want to understand priorities ("Rank by importance: transfer speed, being free of charge, simplicity of the process.") This is always a very complex aspect, and the results must be approached thoughtfully and without haste. Results can only be unambiguous if we surveyed a single, pre-defined user group and the majority responded similarly.
3. Defining the Audience and Distribution Channel
Audience: Determine who we are interested in. New users? Churned users? Active users? It's crucial to segment and not mix apples and oranges so the results are as accurate as possible. Different user categories will have different answers to the same questions.
Channel:
In-product: (e.g., a pop-up using Typeform or Survicate). Best suited for targeting specific users (e.g., those who just completed a certain action).
Email distribution: Suitable for longer surveys but should only be used with loyal users. If we decide to email inactive users with a survey trying to find out why they stopped using our product, we should increase the time intervals between emails as follows: Day 1 >> 2 Weeks >> 1 Month >> 3 Months >> 1 Year >> Never. And always offer some bonuses for returning :)
Recruitment via social media/communities: Useful for finding people with very specific problems, for example, if you are creating a new type of aquarium for some very exotic fish that require special conditions.
A Few Tips for Creating Surveys:
Avoid leading questions (instead of "Don't you think the transfer process is too long?" ask "What don't you like about the transfer process?").
Don't ask questions about the future ("Would you buy our new lawnmower?") — People are poor predictors of their own future behavior.
Avoid overly abstract questions ("What are your thoughts on financial literacy?").
Don't rely solely on surveys; they should only be an additional tool within a unified toolkit for identifying real problems.
If we are a small team just starting out, we can use simple Google Forms to conduct surveys among friends and acquaintances, having them use our product. Of course, for statistically significant data, we'd need no less than 600, and preferably 1000+ respondents, but sometimes even 30 can help reveal a problem, especially when everyone answers one question identically and points us towards existing errors.
Market Research
Market research is often necessary even at the start of developing a new feature, not to mention when launching a new product. The first thing you need to find out is the market's demands, its total size, potential size, and the market share you can realistically target (PAM, TAM, SAM, SOM).
Where and how to gather data for market research is a rather extensive topic worthy of its own separate article. Here, I will only mention that it is crucial to double-check data, multiple times, always. If you make a mistake here, then all the results of our work, no matter how excellent they are, will go down the drain, leaving behind only bitter experience and a hole in the budget.
In simple terms, no matter how great a product you create, it won't bring you profit if the addressable market you can realistically target is very narrow.
Competitor Analysis
Create a separate board in Miro or FigJam where you'll systematically organize all competitors (primarily major players and those from your region if the product is local). Make a list of pros and cons based on what you find in their interfaces. All this information is publicly available, and you can always download the product/request a demo to get hands-on experience.
After completing all research, it's crucial to prepare a brief summary for presenting to the team and stakeholders. Provide them with a link to your presentation so they can refer back to previous slides during discussions. Nothing is more frustrating than a designer dragging everyone through massive Figma frames during a team presentation or interview. With this approach, attention spans will be lost after about three minutes, and you'll essentially be talking to yourself — becoming background noise while others respond by pulling random phrases out of context.
!Important reminder: never create moodboards solely from competitor screenshots. Always document the pros and cons you've noticed. These could include interface elements themselves, their placement, interaction animations — everything you observed. Even if we're the only designer on the project, within a week we'll forget what we liked or disliked about each screenshot. Our colleagues couldn't have known this initially either — they'll only see what their experience and expertise allows them to notice. We're not designers on the project without reason — we should understand design better than others and consequently notice more important details.
Remember, designers have brains for thinking, not for memorizing. Delegate everything that can be delegated! You can delegate to convenient tools too — it doesn't always have to be other people.
Definition (Define)
By this point, we already have several different presentations compiled after each research stage. Now it's time to bring it all together, synthesize the collected information, find key insights within it, and formulate a clear, specific problem that we will solve. We don't always have to prepare a full-fledged presentation for the team after each separate stage; sometimes we must first consolidate and sort everything, and only then present the finished results to the team. So, what stages should be highlighted here?
1. Data Synthesis
We assemble our "Insight Wall" (Affinity Mapping) in Miro or FigJam and begin looking for common patterns. We group our sticky notes by themes, for example, "Fear of making a mistake," "Lack of time," "Not understanding terminology." Names for the groups will emerge naturally and will essentially be our key insights.
2. Defining Opportunities, Needs, and Tasks
Now we need to analyze the grouped insights to formulate conclusions. We define the needs, tasks, and our opportunities.
Needs: What do users truly need?
Formula: "[user type] needs [need] in order to [reason/value]"
Example: «A sole proprietor [user type] needs the ability to quickly separate personal expenses from business expenses when paying via phone [need] in order to avoid spending hours at the end of the month analyzing transaction statements and to prevent errors when filing tax returns [reason/value]».
Tasks: Specific actions the user must perform to satisfy their need. Examples: "Make a payment," "Find transaction history," "Set up a notification."
Opportunities: How can we, as a team, meet these needs? Based on the need to "quickly separate personal expenses from business expenses...", an opportunity might sound like this: "Can we create a system for quick filtering and sorting of payments on the mobile platform that will relieve the user's cognitive load and simplify tax filing? Can we automate these processes to minimally involve the user in the task?".
3. User Segmentation
We cannot design for everyone. Based on the data, we need to identify key user groups for whom we will create the solution. We can create:
User Personas: (Fictional but realistic(!) profiles representing key segments. They include demographics, goals, pain points, motivations, and quotes from real interviews).
It is very important not to invent things for users, but at the same time to hear what they are telling us. For instance, during interviews for a major retail chain, I heard key consumers (Women 30-45 years old) frequently mention that they buy a cheap brand of mayonnaise because they care for their family members. In a business presentation, this might sound like complete nonsense and a total misunderstanding of the users. One might think that in such a case, people are financially constrained and buy cheap mayonnaise just to save money and meet their daily calorie intake, because mayonnaise is cheap and super high in calories.
All that is true, but these women often bought such mayonnaise with the thought of caring for their family, and it was this key insight that became the driver for the main advertising campaign, which, to the surprise of many, worked excellently. Such advertising might seem foolish from the outside, but it touches key triggers in the target audience's mind and evokes empathy. And empathy is one of the foundations of a successful product in the market.
Jobs-to-be-Done (JTBD): An alternative approach where we focus on the "job" the user wants to get done using our product.
Formula: "When [situation], I want [motivation] so I can [expected outcome]".
Example: "When I receive my salary [situation], I want to quickly distribute the money across my accounts [motivation] so I can feel in control of my finances and not worry about debts [expected outcome]".
4. Problem Statement Formulation
This is the main outcome of the entire first diamond. One or two clear phrases that define what problem we are going to solve. If at this stage we still cannot formulate the problem to be solved, we can repeat those previous research steps where we feel there is insufficient data for confident conclusions. This process can be essentially endless, but we shouldn't overdo it, as there are always deadlines for handover to development :) What we need as an output:
Formula: "[User type] needs [need] because [identified insight]. Our current situation/the product's current state [current problem] causes [negative consequence]".
Example: "Busy young parents need a simple and reliable way to pay utility bills because they constantly forget about due dates in their daily hustle. The current complex, multi-step manual payment process leads to late payments, stress, and distrust in the service."
Outcome: What You Should Have After the Define Stage
Before moving to the second diamond (solution finding), we should have a package of documents understandable to the team and stakeholders:
A formulated Problem Statement — "what" we are solving.
A set of key insights — "why" we decided to solve exactly this.
User Personas or JTBD frameworks — "for whom" we are doing this.
A Current State User Journey Map — "how" the problem manifests within the context of their entire experience.
What do we do next?
Next, we need to align and get agreement on all these artifacts with the entire product team and stakeholders. Only when everyone understands and agrees on the problem can we proceed to the second diamond (Diamond 2: Solution) and start generating ideas to solve it — brainstorms, sketches, prototypes. I will talk about all of this in the second part of this article.
All these frameworks are great things on their own, and sometimes we genuinely need all of them, but it's important to know how to choose the most critical and minimally necessary ones for the current problem, while remembering how resource-intensive they are. After all, the business pays for every hour of every employee participating in this framework. For us, a CJM (Customer Journey Map), for example, might represent 1-6, or even 12+ months of work, but for the business, this amounts to hundreds of thousands of dollars. And here our task is to convince the business that this is a good investment and that in return, it will receive significantly more value.
How Can Neural Networks Help Us?
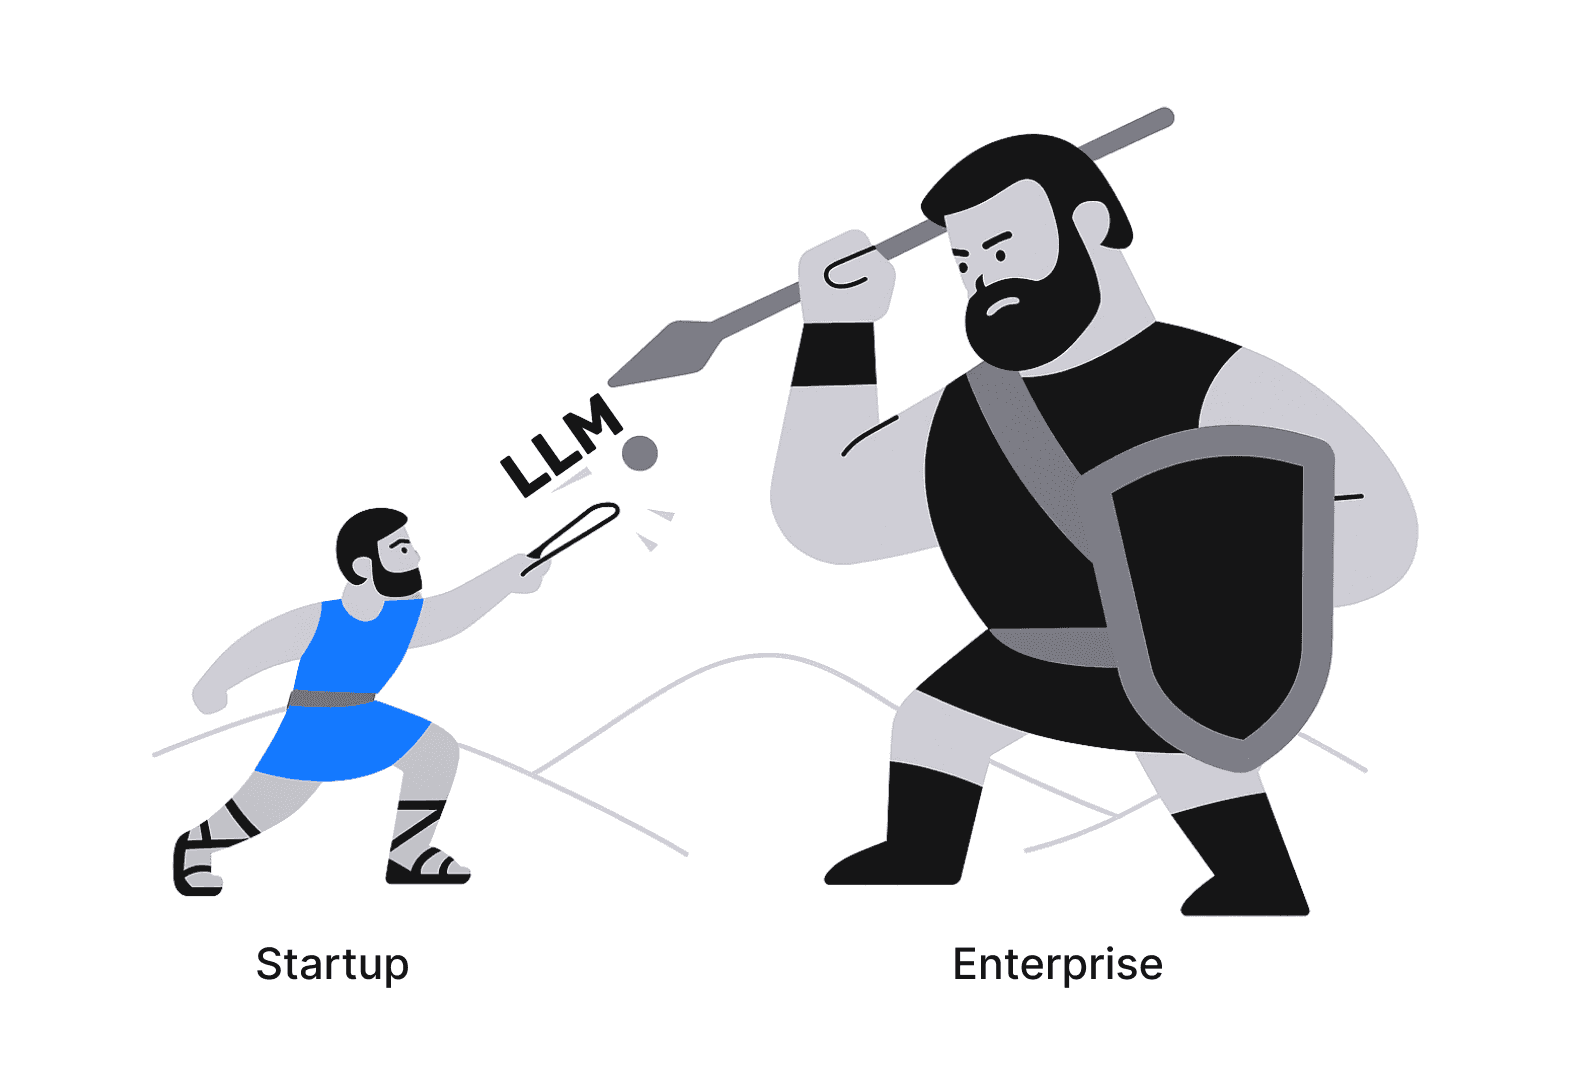
So, we've finally reached the part of the article where I'll explain what we can do if we don't have sufficient resources for extensive product research. Let's say we're an ordinary small startup of 3-7 people and can't afford to order live user interviews from an agency, we don't have our own users yet, but we still want to solve a real problem (which may well differ from our initial assumptions).
We've talked to stakeholders, studied market demands and our competitors, dissected every piece of their interfaces, but we still don't see the main thing. We see the results, but we don't see the data that other designers relied on, we don't see the tasks they were solving.
For a product to "take off," it must address specific user pain points better and more simply than competitors. Therefore, it's crucial for us to identify the exact pain points we will address. (When launching a new startup, remember you shouldn't try to solve all pain points at once — you won't succeed. Address the most in-demand ones, the ones people are willing to pay for).
Actually, any startup should begin precisely by identifying the user's real pain points, market demands, and its potential size — unless, of course, it's just your hobby and you don't expect the project to be profitable at all :)
So how can neural networks help us understand our users?
Neural networks can be utilized at any stage when developing a new feature or improving an existing one. We can always ask them to analyze our competitors' interfaces and provide us with a list of pros and cons, describe possible corner cases and pitfalls, to then compare with our own vision and potentially add something.
But let's focus now on one interesting use case: in a deep research mode, neural networks can be directed to thematic threads on various forums and social media groups with the goal of identifying the pain points of real users, sorting them by frequency of occurrence and critical importance during use, and providing real user quotes with links to the thread sources to verify the data's reliability.
This saves a tremendous amount of time and money, because when people complain about something on forums, they are extremely honest. Their frustration with their existing problem is strong, and they want to share it with others, hoping someone has already solved the same issue.
Yes, some forums block access for neural networks, like Reddit, which blocked access for all neural networks except for Google's Gemini, because Google pays for access to the site. But I believe that others will either pay for access, or there will always be those who have already done so, and we will have to choose from the list the ones most suitable for us.
For example, in one of my projects, Noetro (an email application with neural network integration), we discovered that most users want smart email grouping, while also wanting to use each incoming email as a to-do task, and want to see only important emails from pre-sorted categories.
Initially, we wanted to reduce the cognitive load of handling email through short email summaries and suggestions to add something from the context to a to-do list. We thought this would revolutionize the traditional email workflow, making it simpler and more convenient.
When it turned out that besides high cognitive load, poor sorting, and perpetual inbox chaos there were these additional pain points, we created a separate folder within the client called "Digest." It resembled the familiar "Inbox" folder, with the key difference that emails could be read an infinite number of times while always remaining "unread." Removing an email from this list could only be done manually by clicking a "Done" checkbox that appeared when hovering over the email.
This was an excellent solution because teaching users something radically new is always difficult. Over the last 15 years, familiar patterns of behavior and interaction with interfaces have already been established. But this doesn't mean that what we see now is perfect; there's always room for growth. Just recall iOS 16 and the dynamic tab bars with search at the bottom of the screen, right under our thumb, which sometimes transform into just a single target button. It's absolutely genius; I'm sincerely impressed by such a solution.
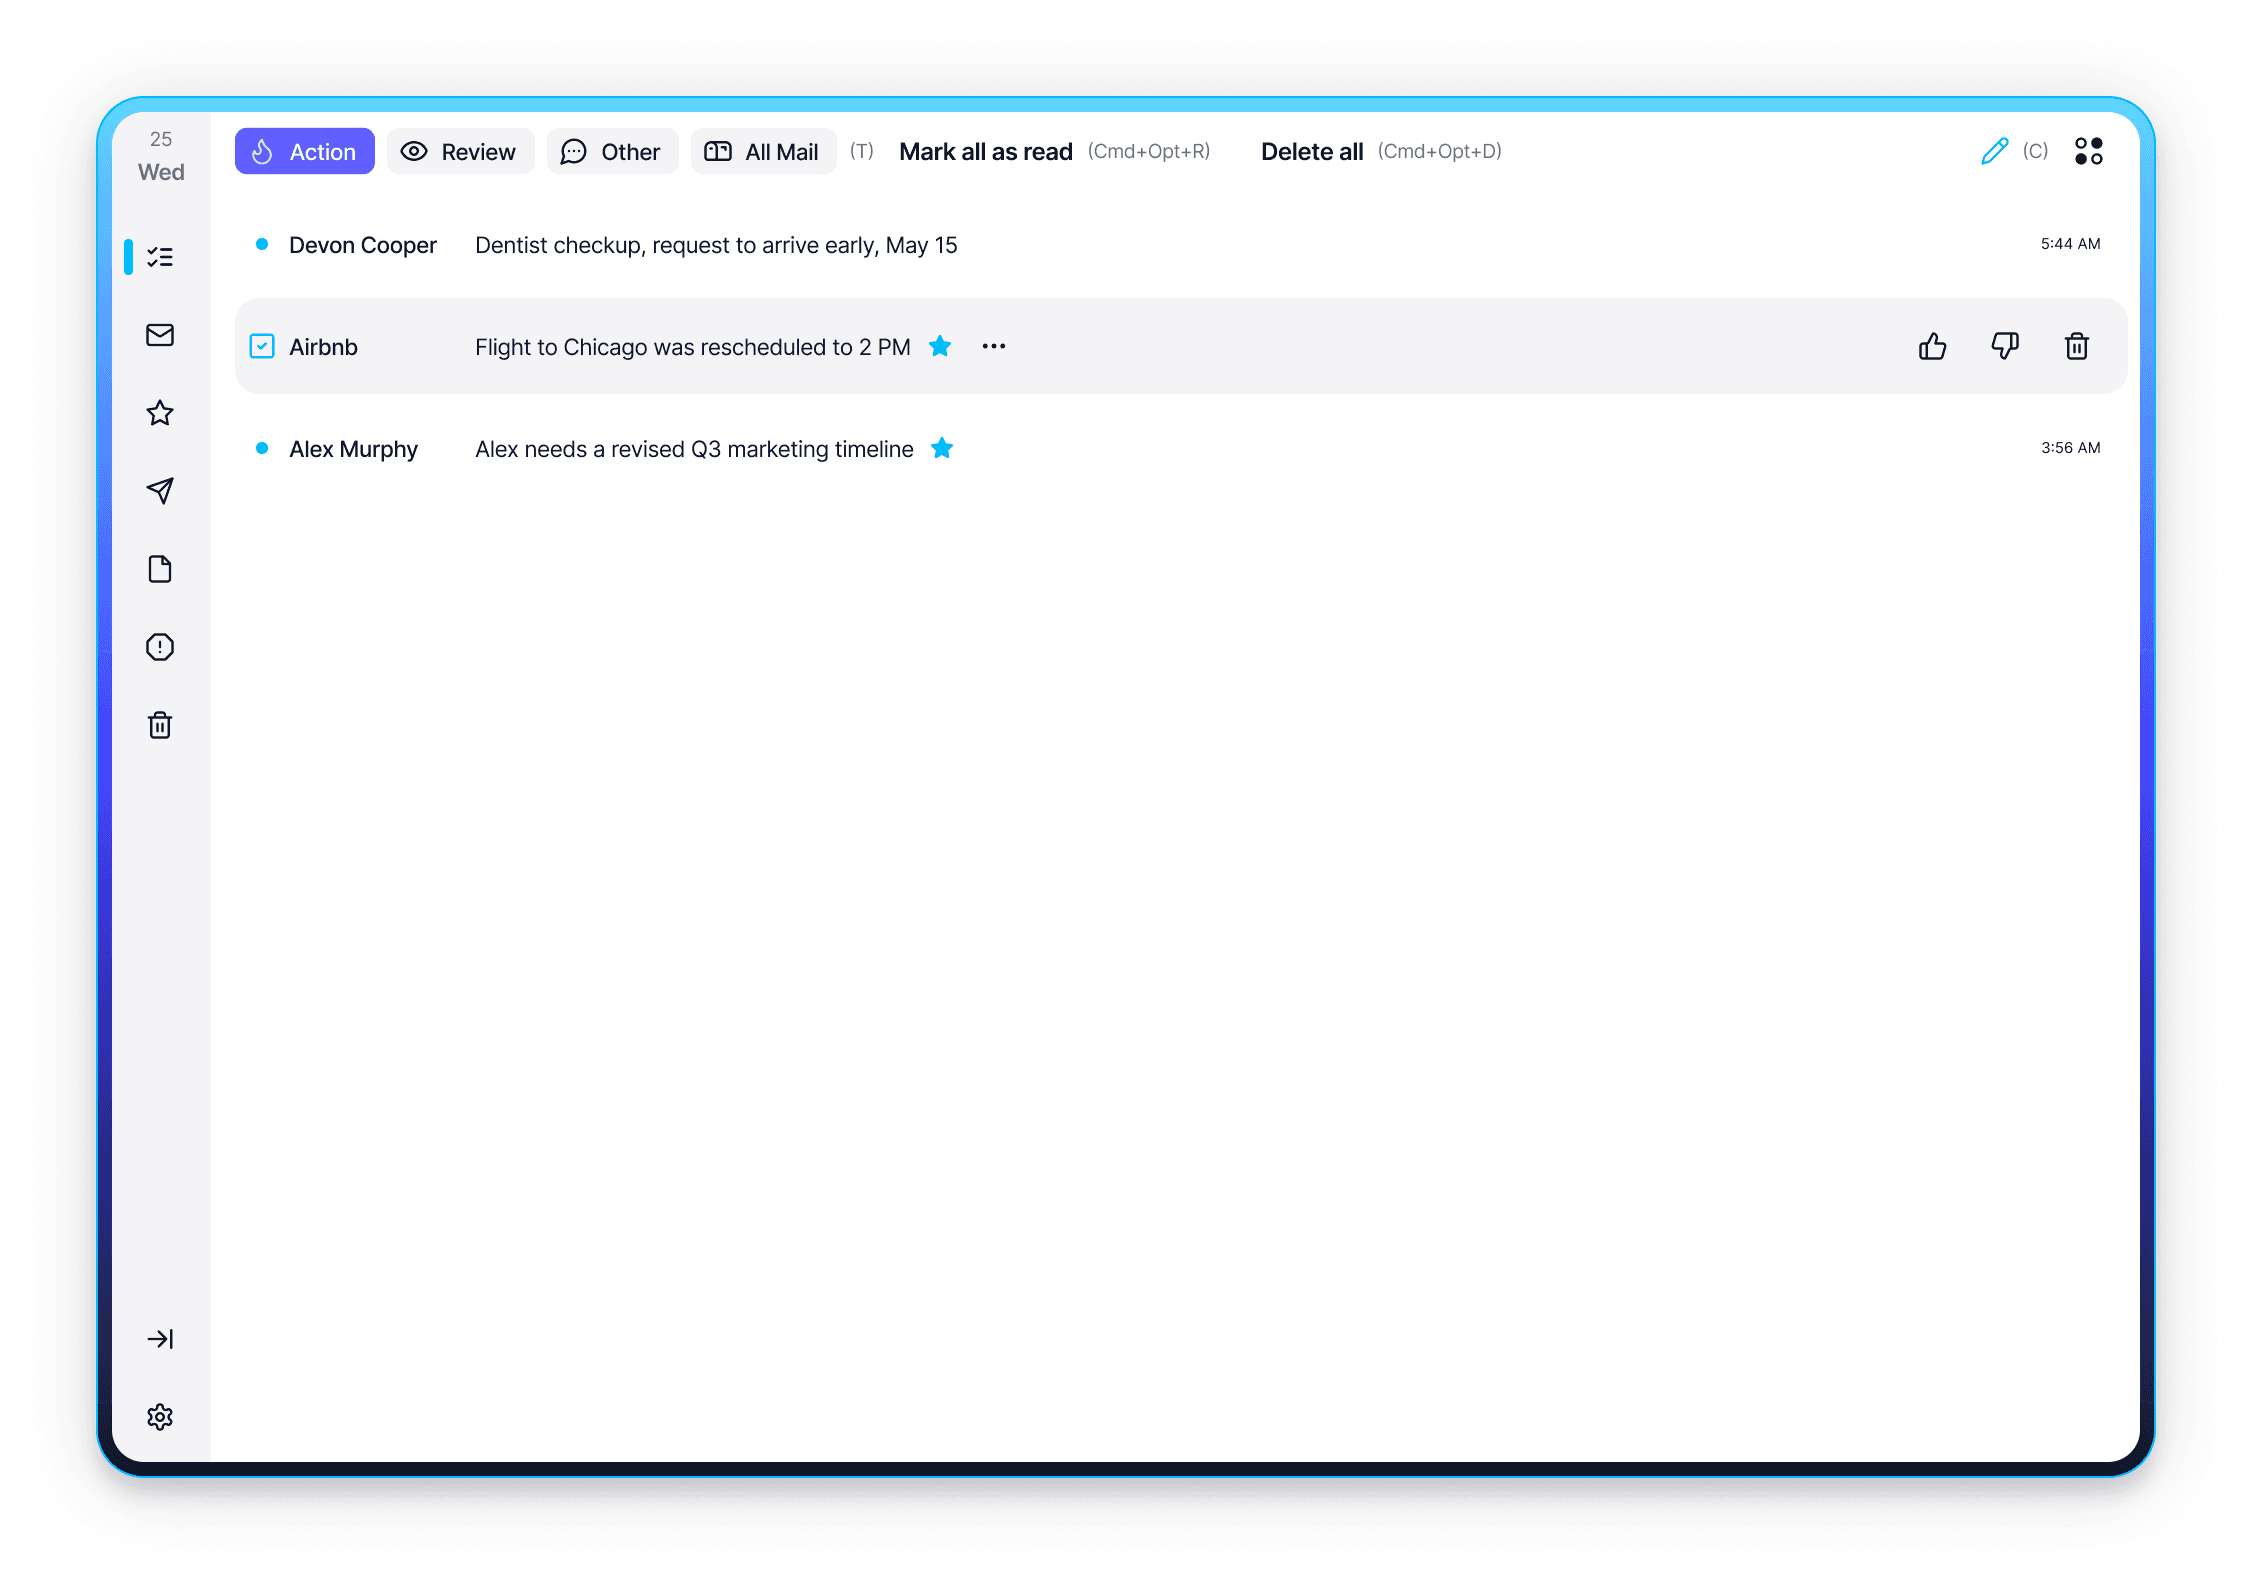
Returning to our example: having created a to-do list from incoming emails, we also added categories for emails based on the Eisenhower Matrix:
Action (Urgent and Important) — Important emails requiring some urgent action from the user.
Review (Important, but not Urgent) — Important emails that are not urgent.
Other (Others) — Promotional emails, newsletters, receipts, and other advertising you subscribed to yourself.
All mail (All Mail) — All mail together (excluding spam, of course).
Here are a few examples of quotes we analyzed:
"Stop showing 10 separate emails for the same Slack thread. Collapse them like Discord messages.”
”I don’t need more features — I need clarity. Tell me what’s critical, hide the rest, and let me trust the system”
Thus, thanks to neural networks, we identified more pressing user pain points that needed to be addressed. Honestly, our list contained about 80 pain points (of which we addressed around 30 during the MVP stage) that bother email users, but these were the highest priority. And we successfully dealt with them :)
In the second part, I will focus in more detail on the second diamond — solution finding and delivering those solutions to production. In the third part, I will share step-by-step guides for everyday design processes and checklists for designers before review handoffs, and the final check before handing off to development.
Create for good :)
Contacts
Interested in working together?
If it seems to you that we are on the same wavelength, feel free to drop me an email:
I believe in the Spaghetti Monster
He does not allow me to work with representatives
of the gambling/porn industries as well as with Russian government agencies
I’m Sorry 🤷🏻♂️
Alexey Yarkin © 2025
